Introducing NOVA and Satiety Scores: Smarter Food Tracking for Better Health

We're excited to announce two powerful new features in Food Loops that will help you make more informed food choices: NOVA Scores and Satiety Scores. These science-backed metrics go beyond simple calorie counting to help you understand what you're really eating and how it affects your hunger and health.
What Are These Scores?
NOVA Score: Understanding Food Processing
The NOVA Score (1-4) tells you how processed your food is, based on the internationally recognized NOVA classification system developed by researchers at the University of São Paulo. This simple rating helps you identify ultra-processed foods that research links to various health concerns. The Four NOVA Categories:
🟢 NOVA 1 - Unprocessed or Minimally Processed Foods
Natural foods altered as little as possible: fresh fruits and vegetables, fresh meat, eggs, milk, and whole grains.
🟡 NOVA 2 - Processed Culinary Ingredients
Substances extracted from foods or nature, used to prepare and season: oils, butter, sugar, salt, and vinegar.
🟠 NOVA 3 - Processed Foods
Foods made by adding NOVA 2 ingredients to NOVA 1 foods: canned vegetables, salted nuts, cheese, and freshly made bread.
🔴 NOVA 4 - Ultra-Processed Foods
Industrial formulations with five or more ingredients, including substances not commonly used in home cooking: soft drinks, packaged snacks, instant noodles, and many ready-to-eat meals.
Satiety Score: Predicting Fullness
The Satiety Score (0-100) predicts how filling and satisfying a food will be. Higher scores indicate foods that keep you fuller longer, helping you naturally eat less and maintain a healthy weight. This score is based on cutting-edge research from the Hava.co methodology and scientific studies on satiety, energy density, and food palatability.
How It's Calculated
The score combines four key factors:
- Protein Percentage (35% weight) - Protein is the most satiating macronutrient. Foods with 50% of calories from protein receive the maximum score.
- Fiber Content (20% weight) - Fiber adds bulk and slows digestion. Target: ~30g fiber per 1000 calories for high satiety.
- Energy Density (25% weight) - Lower calorie density means more volume for fewer calories. Foods under 0.6 kcal/g (like vegetables) score highest. Liquids are penalized as they're less satiating than solid foods.
- Craving Factor (20% weight) - Penalizes "hyper-palatable" foods that override natural satiety signals (foods combining fat and carbs, especially sugar, or high in sodium).
Score Ranges:
🔴 0-33 (Low Satiety) - Less filling foods that may lead to overeating
Examples: sugary drinks, candy, highly processed snacks
🟠 34-66 (Moderate Satiety) - Moderate fullness, may require portion control
Examples: pasta, bread, moderate-fat foods
🟢 67-100 (High Satiety) - Highly satiating foods that keep you fuller longer
Examples: lean proteins, vegetables, whole grains, legumes
Where You'll See These Scores
Both scores are seamlessly integrated throughout the app to help you make better decisions in real-time:
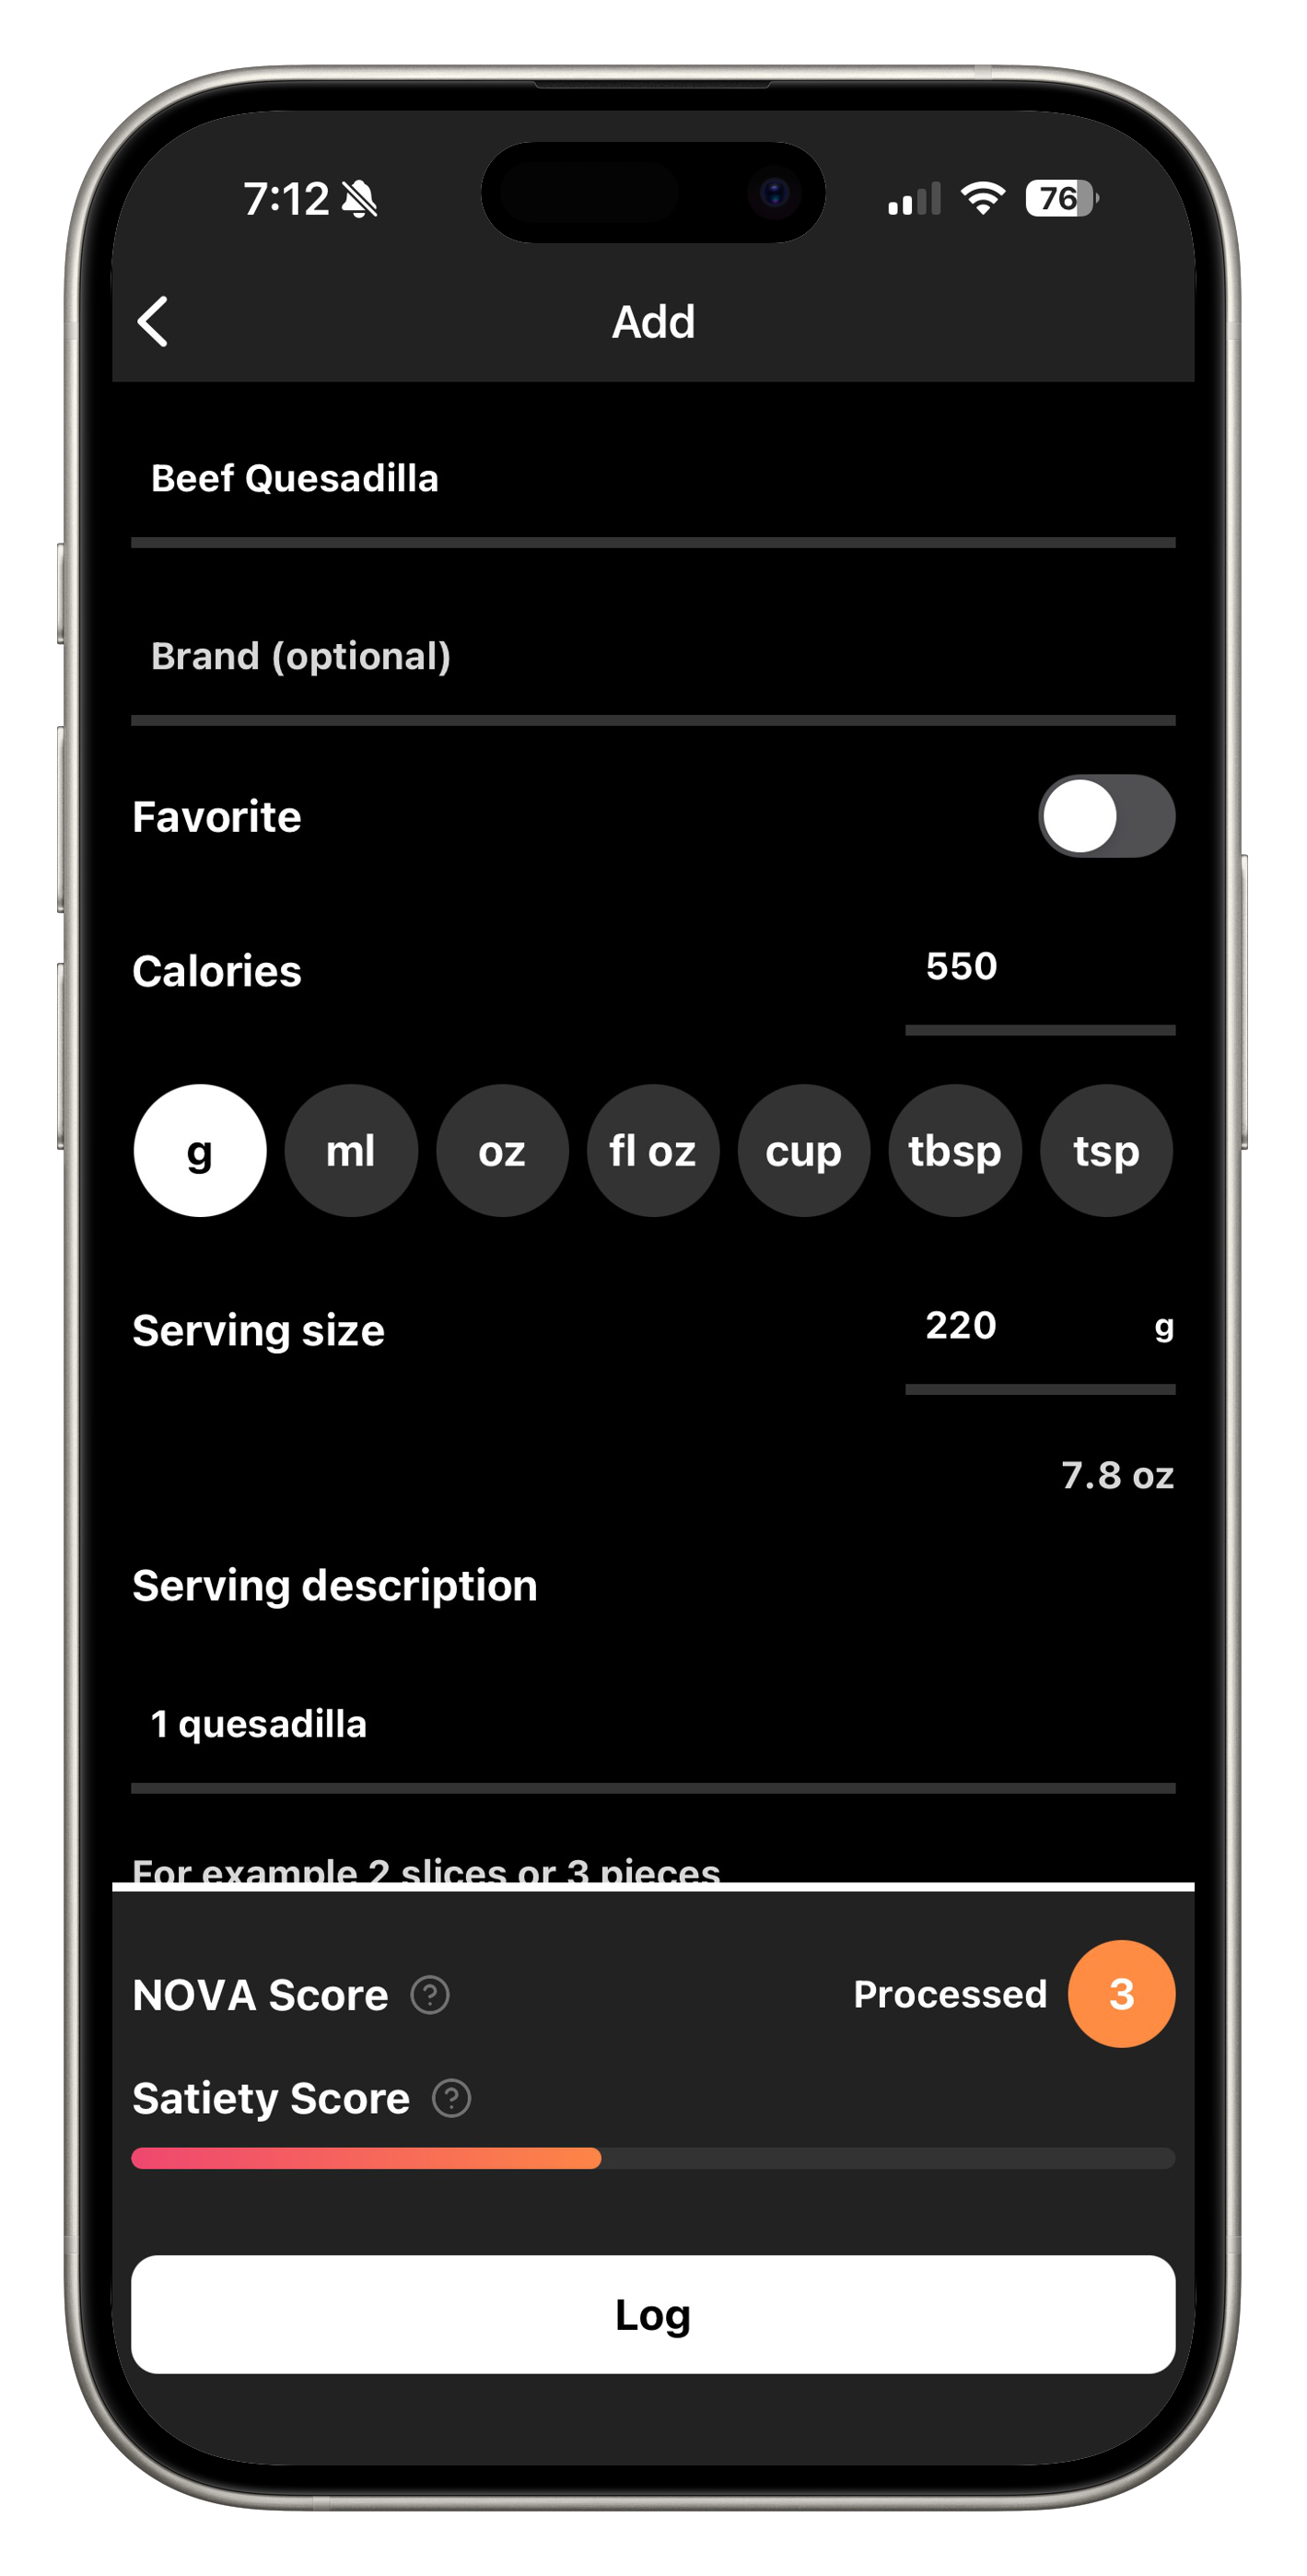
1. Food Creation & Editing
When you create a new food or edit an existing one, the NOVA and Satiety scores appear at the bottom of the screen in the form footer. The NOVA score shows as a colored circle (green to red) with the category description, while the Satiety score displays as an animated gradient bar that fills from red (low) through orange to green (high).
2. Food Logging
When logging meals, you'll see these scores displayed for each food, helping you understand the quality of your food choices at a glance.
3. Food Tracking
As you track foods throughout the day, the scores help you identify which foods are keeping you satisfied versus which might be triggering cravings or leaving you hungry.
4. AI Food Analysis
When using our AI-powered food description or barcode scanning features, the app automatically calculates both scores based on the nutritional information, giving you instant insight into new foods.
Making Smarter Choices
These scores work together to paint a complete picture of food quality:
- A high NOVA score (3-4) combined with a low Satiety score (0-33) signals ultra-processed, hyper-palatable foods that are easy to overeat
- A low NOVA score (1-2) with a high Satiety score (67-100) indicates minimally processed, highly filling foods that support weight management
By prioritizing foods with low NOVA scores and high Satiety scores, you can naturally improve your diet quality without obsessing over calories.
The Science Behind It
Both metrics are grounded in peer-reviewed research:
- NOVA Classification: Extensively studied in nutritional epidemiology, with research showing associations between ultra-processed food consumption and various health outcomes
- Satiety Science: Based on decades of research into protein leverage, fiber effects, energy density principles, and food palatability studies
Ready to make smarter food choices? Start paying attention to your NOVA and Satiety scores today and experience the difference that food quality makes in how you feel. Have questions about these scores? Check out the app's FAQ section or reach out to our support team. We're here to help you succeed!